We must look clearly at the huge increase in incarceration and the enormous disparity in Wisconsin’s incarceration rates: more than 23,000 people in prisons and among the highest rates of racial disparity in the nation.1
While states from coast to coast and from the South to the Rust Belt have undertaken major initiatives to reduce prison populations and patterns of racial disparity, Wisconsin has not. Instead, Wisconsin’s prison population is accelerating upward, reaching and expected to surpass its highest historical numbers and matched by a rising budget and proposals for a new prison, on top of annual operating expenses in excess of $1 billion.2
This article is first in a series that will explore the realities and costs of mass and disparate incarceration for Wisconsin residents and communities and how Wisconsin might change course. As the first, it takes stock of how Wisconsin moved to this point over the past several decades and what our current circumstances are.
The numbers tell the story.
Mass Incarceration
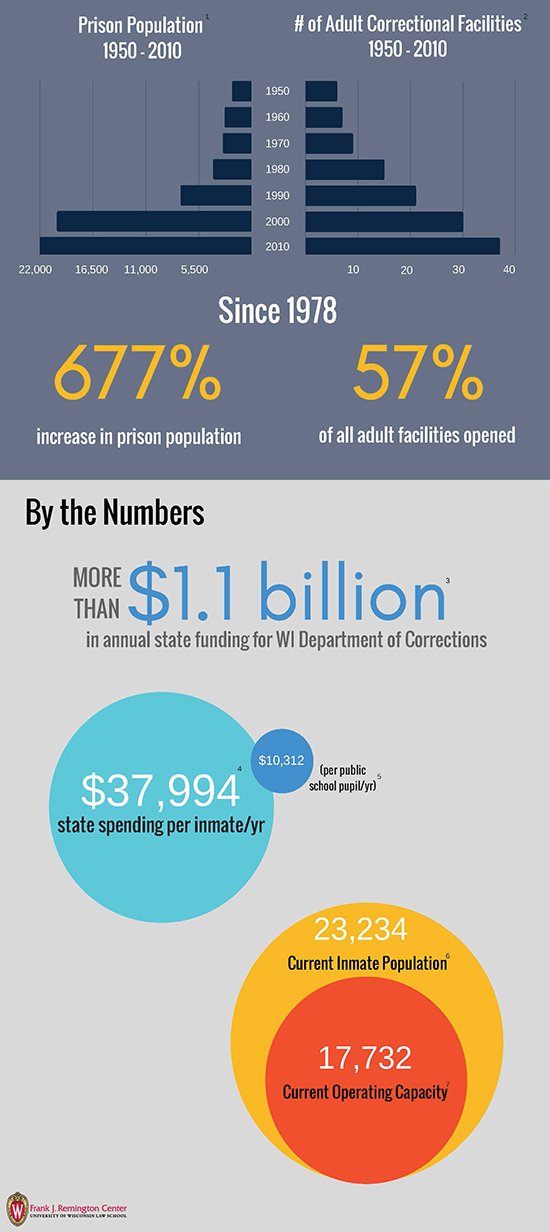
After a modest decline in the prison population since its peak in 2007, at the end of 2017 Wisconsin was poised to incarcerate more people in its 37 prisons than at any time in its history.3 Despite having opened 15 prisons since 1990 – eight in the 1990s and another seven in the 2000s – plans have been advanced to build again. Wisconsin prisons are well above their design capacity,4 and the state is increasingly contracting with county jails to hold hundreds of overflow prisoners.5 Although the Wisconsin Department of Corrections’ (DOC) proportion of the general fund budget more than doubled from 1990 to 20166 and now exceeds $1.2 billion annually,7 the DOC faces staffing challenges, ballooning costs arising from an increasingly older and sicker population, and calls for programming that it cannot meet with the resources it currently receives.
Mass Disparity
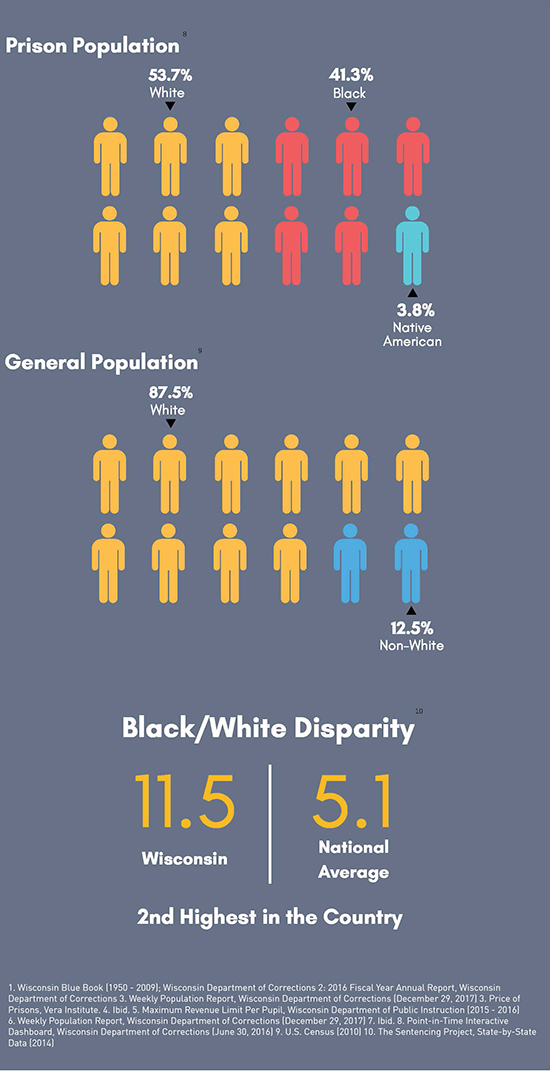
Wisconsin incarcerates non-white persons at far higher rates than whites and at rates of disparity far above the national average. The percent of African-American males admitted to Wisconsin prisons has decreased since 2000 (from 48 percent to 37 percent of total admissions),8 but African-American males still comprise 43 percent of the total male prison population.9 Prison admissions of Native Americans increased over the same period and were more than 5 percent of admissions in 2016.10African-Americans and Native Americans make up 6.6 percent and 1.1 percent of the Wisconsin population, respectively.11
 Mary Prosser, U.W. 1977, is a clinical professor at the U.W. Law School’s Frank J. Remington Center, where she has worked since 2003 in the Legal Assistance to Institutionalized Persons Project (LAIP) supervising students providing assistance to state inmates. She also teaches first-year criminal law courses. She is a member of the State Bar Criminal Law Section board and cochair of the Committee on Mass and Disparate Incarceration.
 Shannon Toole is a second-year law student at the U.W. Law School. She is a clinical student in the Legal Assistance to Institutionalized Persons Project. She is also a member of the Moot Court Board and the Wisconsin Law Review, as well as a research assistant for Prof. Cecelia Klingele.
The decline in the percentage of African-American men admitted to prison is consistent with a positive national trend, as are dramatic changes in the demographics of women in prison.12 The proportion of African-American women in Wisconsin prisons is less than one-half what it was in 2000, while the proportion of Native American women has doubled, and the number of white women has increased by more than 40 percent.13
Despite some decrease in disparity in the adult prison population overall since 2000, Wisconsin continues to have one of the nation’s highest rates of disparity in the confinement of African-Americans compared to whites. Across the country, African-Americans are incarcerated in state prisons at more than five times the rate of whites.14 In five states, however – Wisconsin among them – African-Americans are incarcerated at more than 10 times the rates of whites.15 Indeed, in Wisconsin, although white incarceration rates are lower than the national average, current disparity rates are twice the national average, with blacks being incarcerated 11.5 times more often than whites,16 giving Wisconsin the second highest rate of black-white incarceration disparity in the country.17 Wisconsin also has one of the highest rates of disparity in the incarceration of Native Americans compared to whites.18
While racial disparities for adult African-Americans are decreasing, racial disparity in youth commitments has not declined. Wisconsin was one of 14 states that saw increases in disparity in commitments of Hispanic, African-American, and Native American youth in comparison with white youth between 2003 and 2013. The disparity in commitment rates of these youth compared to white youth almost doubled during this period.19
These current realities, combined with an increased understanding of the impact of mass incarceration on families and communities, as well as on prisoners, make it timely to ask if there are equitable, cost-effective, and safe alternatives to our current practices and policies.
Figure 1
The Growth of Incarceration in Wisconsin
Graphics: Greg Grohman. Infographics: Greg Grohman
The Path to Mass Incarceration
Mass incarceration and disparate confinement are not new issues: many people have raised their voices to call attention to them.20 Most Americans are aware of the historic explosion of state and federal prison populations across the country. Nationally, the prison population has increased 500 percent over the past 40 years,21 while in Wisconsin, the prison population increased almost 700 percent over the same time, from 3,400 prisoners in 1978 to more than 23,000 today.22 The largest increase occurred in the 1990s; within that decade annual prison admissions more than doubled, raising the prison population from 7,000 in 1990 to more than 20,000 by the end of 1999.23 Legislation that took effect in 1995 gave judges the option to impose a life sentence without the possibility of parole24 and permitted the Parole Commission to retain certain offenders beyond their otherwise-applicable mandatory release dates.25
Large-scale growth in the prison population was followed by large increases in the scale of permissible sentences across all other felony classifications. The state’s truth-in-sentencing legislation, 1997 Wis. Act 283, eliminated parole and increased the penalties for offenses by at least 50 percent, and in some instances by more than 100 percent. The maximum sentence for a Class B felony increased from 40 years to 60 years, with 40 years’ possible confinement, while the maximum penalty for the lowest felony category more than doubled, from two years to five years.26
Wisconsin prisons are well above their design capacity, and the state is increasingly contracting with county jails to hold hundreds of overflow prisoners.
In addition to expanding confinement time, the new sentencing laws increased the available length of post-imprisonment community supervision. The laws set a minimum requirement for some felonies that community supervision was to constitute at least 25 percent of the entire term of imprisonment but did not originally set an upper limit (other than the maximum sentence) on the length of supervision a judge could impose. This was changed in later statutory revisions, although sentences of extended supervision can still last for decades.27
If a person being supervised is returned to prison for a rule violation at any point in the sentence, however late, no credit is given for time already served on community supervision. Consequently, she could be returned to prison to spend the entire period of supervision (or parole) confined.28
Wisconsin’s embrace of longer maximum penalties and acceptance of higher prison populations means that today’s prison population is different from the population in 2000, with very different needs. On average, prisoners are now significantly older. The proportion of persons age 45 or more increased by 120.9 percent between December 2000 and 2016, while the proportion of persons age 24 or younger decreased by almost half. The average age increased by five years, to 38. More than 1 out of 20 Wisconsin prisoners are now 60 or older, an increase of 350 percent.29
Today’s prisoners are also serving more time behind bars. More people are serving life sentences,30 and those who are not have, on average, more time remaining on their sentences than was true in 2000. The percentage of persons with five or more years left to serve, not including lifers, increased by 28 percent between 2000 and 2016. More than one-third of today’s prisoners have at least five years left to serve.31
Wisconsin’s embrace of longer maximum penalties and acceptance of higher prison populations means that today’s prison population is different from the population in 2000, with very different needs.
Among those are more than 2,000 prisoners serving parole-eligible sentences imposed for offenses committed before 2000.32 These inmates are an older and, in many ways, a forgotten population. As of Dec. 31, 2014, 2,618 parole-eligible inmates were incarcerated in Wisconsin prisons. Most have been in prison since their sentencing: at the end of 2014, 54 percent had served between 11 and 20 years, while 29 percent had served more than 20 years behind bars. Their average age was 48 years old as of the end of 2013, and 80 percent were at least 40 years old.33
These parole-eligible prisoners have experienced the secondary effects of truth-in-sentencing. As new prisoners entered the system with no parole eligibility, parole releases for those who remained eligible fell – a phenomenon seen in many other states, too. From 1990 to 1997, most persons were granted discretionary parole, with the amount of time served until release ranging from 40 to 57 percent of the sentence, depending on the nature of the offense.34 In 2000, 27.5 percent of the prison population was released on discretionary parole, dropping to 7.3 percent in 2006, and ranging from 1.5 to 2.1 percent since 2012.35
Early release mechanisms enacted for inmates sentenced under the new truth-in-sentencing laws, such as geriatric release and release based on an extraordinary health condition, do not apply to prisoners serving parole-eligible sentences.36
The Potential for Change
Given the enormity of the growth in imprisonment, and the degree to which disparities exist, it is not surprising that some Wisconsin counties have already taken steps to reduce reliance on incarceration, racial disparities, or both. Prison admissions from Milwaukee County decreased more than 30 percent between 2007 and 201637 after the district attorney’s office collaborated with a research and policy group to examine whether prosecutorial practices might be contributing to racial disparities.
Based on evidence gathered in that study, the office began placing prosecutors in neighborhood offices, put an early intervention and diversion program in place, and reduced prosecutions of low-level drug offenders.38 Still, Milwaukee County admissions constituted 35.8 percent of all persons sent to prison in 2016 on the basis of only a new sentence,39 and large racial disparities in youth commitments persist.40
For an example of alternative approaches tried outside Wisconsin, Minnesota is a good case study. Despite its similarity to Wisconsin in area, demographics, and crime rates, Minnesota’s rates of prison incarceration, jail incarceration, and corrections expenditures are about one-half those in Wisconsin.41 Michael O’Hear, a professor at Marquette Law School, has hypothesized that the difference may be due to the states’ different areas of focus: “Minnesota is emphasizing probationary sentences, and Wisconsin is emphasizing sentences of imprisonment.”42 Despite these different approaches, O’Hear notes there appears to be “little dramatic difference in public safety outcomes.”43
It might be possible to create an avenue that would permit a person to seek termination of supervision after completing a significant portion of the supervision period or a designated amount of time without committing significant violations of the conditions of supervision.
While Minnesota has historically had a lower prison population, many other states have attempted to reduce their prison populations in recent years. According to a national survey conducted in 2016, 38 states had achieved a reduction in prison population from their peak, including 16 states that have achieved double-digit rates of decarceration.44 Six states have reduced their populations by more than 20 percent. California, New Jersey, and New York have reduced their prison populations by approximately 25 percent, and their violent-crime rates have declined faster than the national average.45
To accomplish these goals, states are experimenting with combinations of changes in local practices, legislation, and executive initiatives, designed to reduce both admissions at the front end and lengths of stay at the back end.46 Some localities and states have experimented with eliminating the use of cash bail and using risk-assessment tools to make pretrial detention decisions, cognizant of the research that indicates that pretrial detention is associated with higher conviction rates and longer sentences for the detained defendants47 – a potentially important source of race and class disparities in the criminal justice system. Additionally, many prosecutors’ offices are investing in diversion programs that may lead to fewer criminal records and jail or prison terms and avoid the collateral consequences of criminal conviction in cases in which they are not warranted.
To reduce the length of sentences, many states are expanding opportunities for prisoners to “earn” credit for participation in educational, vocational, treatment, or service programs in prison.48 This approach incentivizes participation in targeted programs and reduces custody time for those who successfully participate. Another approach is to limit the consequences of revocation of probation or parole arising from violations of so-called technical (noncriminal) rules of supervision rather than from new criminal offenses.49
Persons released to community supervision could be given partial credit for “successful” time spent on community supervision.
Illinois combines this approach with shifting primary responsibility for such violators to the county, rather than to the state prison system.50 Illinois’ new prison-reform initiatives also include a state program that focuses on providing funds to community-based county-level services, thus giving counties incentives to divert people from prison by keeping them in the community.51
These initiatives are just a few of the many models being evaluated or adopted across the country to reduce prison populations and disparate confinement.
Figure 2
The Growth of Incarceration in Wisconsin
Graphics: Greg Grohman. Infographics: Greg Grohman
Possibilities for Experimentation in Wisconsin
Could any of these approaches work in Wisconsin? It might be worthwhile to test ideas about what is effective in protecting the public and in reducing the financial and human costs of incarceration and disparity in the criminal justice system. Given the structure of current Wisconsin sentencing laws, there are many opportunities for experimentation at a variety of points in the criminal justice system. A few are discussed below.
For those on community supervision (parole or extended supervision), it might be possible to create an avenue that would permit a person to seek termination of supervision after completing a significant portion of the supervision period or a designated amount of time without committing significant violations of the conditions of supervision. (A similar option is currently available to persons on probation.)52 Research shows that a person’s risk of reoffending is greatest in the period immediately following release.53 A recent DOC study reported that one-half of those who re-offended54 within a three-year period did so within the first year following release from prison, and 75 percent re-offended within 21 months. Recidivism rates for persons who had served five or more years were the lowest, at 15.7 percent after three years.55 Recognizing success on supervision in this way would free up resources needed to supervise persons with greater needs or who pose a greater risk to public safety.
Second, persons released to community supervision could be given partial credit for “successful” time spent on community supervision, that is, time during which the person complies with any restrictions imposed on him (for example, curfews, GPS monitoring, restrictions on employment and housing). Under this policy, those who complied with the rules of supervision could shorten their exposure to reconfinement by some proportion of the time they were successful on supervision. Those who are never revoked could shorten the length of supervision, while those who comply for a prolonged period before committing a violation could be reconfined for less time than the person who violated his supervision in the first month. This approach would both reward individuals who comply with supervision and recognize to some measure that the record on supervision was mixed and not a complete failure.
Another possibility would be expanding opportunities for early release based on age or extraordinary health concerns. Such an approach would be both consistent with public safety and responsive to the enormously expanding financial burdens placed on the prison system by aging and sick prisoners. Release of elderly and seriously ill persons who no longer present a threat to public safety would also reflect the unique human and end-of-life realities faced by these prisoners and their families. The population of persons eligible for release on either of these grounds could be expanded to include those convicted of additional felonies and to parole-eligible inmates.
Finally, to reduce racial disparities in particular, Wisconsin could commit to systematically collect and disseminate data to inform decision-making in the criminal justice system. A number of states already require their courts and corrections departments to maintain data on racial disparities and to provide that data, updated on a regular basis, to judges, prosecutors, and defense attorneys throughout the state. In addition, steps could be taken to encourage or require that prosecutors, judges, and corrections personnel consider the data on racial disparities in making charging, bail, plea-bargaining, diversion, sentencing, and correctional decisions.
Conclusion
Wisconsin can continue on its current path of increasing incarceration and continuing racial disparities, even in the face of burgeoning budgets, strained resources, and the human costs these entail. Alternatively, Wisconsin could begin to take a leadership role in proposing and trying less costly measures that could improve our criminal justice and corrections systems and promote public safety. Future articles in this series will focus on more specific topics and offer suggestions for reform.
Owning the Problem
By Fran Deisinger, Paul Swanson & Chris Rogers
In the year 1990, Wisconsin imprisoned approximately 6,000 people. Today, more than 23,000 people are incarcerated – in a prison system with a capacity far smaller. This astonishing explosion in our prison population has had enormous social and financial consequences for our state and its families, communities, and taxpayers. Yet the experience of Wisconsin compared to similar states with much lower rates of incarceration suggests that we are no safer for these immense costs. This raises urgent questions about whether we are administering our criminal justice system prudently and fairly – from the laws that control it to its practice at ground level.
Because lawyers are integral to the justice system at every level, the three presidents of the State Bar of Wisconsin believe strongly that mass and disparate incarceration are issues that we must examine and respond to as a profession. (The rate of imprisonment in Wisconsin for African Americans, Native Americans, and Hispanic Americans is grossly out of proportion to their representation in our population.)
Let’s be clear: these problems are complex and the issues they raise can be contentious. But the stock in trade of lawyers is to study hard legal problems and find solutions. In truth, many Wisconsin lawyers have been working on these issues for years, whether as scholars, advocates, judges, or legislators. Last year, the State Bar began an initiative to bring some of these lawyers together to continue, and, we hope, amplify and accelerate that work. We held a symposium in Madison to begin that process, and from that start we formed a work group that is meeting regularly to develop and propose legislative, practical, and educational responses. Starting in this issue of Wisconsin Lawyer, we will publish a series of articles addressing different facets of the incarceration crisis.
We believe that incarceration in Wisconsin, while necessary, should be fairer for our citizens, safer for our communities, and less disruptive to our state’s budget. We believe all Wisconsinites would want that. We ask you, our members – the sworn protectors of equal justice under the law and practical, problem-solving professionals – for your attention and your assistance.
 President Paul Swanson, Oshkosh
 President-Elect Chris Rogers, Madison
 Past-President Fran Deisinger, Milwaukee
Endnotes
1 Joe Forward, Mass and Disparate Incarceration in Wisconsin: It’s Our Problem, InsideTrack (March 1, 2017).
2 See, e.g., Wis. Leg. Fiscal Bureau, Comparative Summary of Provisions: 2017 Act 59, at 205-29 (2017).
3 As of Dec. 29, 2017, there were 23,234 persons in prison, just short of the record high of 23,236 in 2007. Wis. DOC, Department of Corrections: Offenders Under Control on 12_29_2017 (Dec. 29, 2017), [https://perma.cc/RN9F-LA68]; Wis. DOC, Wisconsin Prison Point-in-Time Populations: 2000-2016 (2017) [https://perma.cc/48CA-QK2A]. The prison population increased by more than 600 in 2017. Id.
4 The prisons now house a population that is 30 percent above design capacity. See Wis. DOC, Department of Corrections: Offenders Under Control on 01_05_2018 (Jan. 5, 2018) [https://perma.cc/AFA4-9TKL].
5 Use of contract beds more than doubled in 2017, from 216 to 450. Wis. DOC, Department of Corrections: Offenders Under Control on 01_06_2017 (Jan. 6, 2017) [https://perma.cc/P4HS-VRLX]; Department of Corrections: Offenders Under Control on 12_19_2017, supra note 2.
6 Inside Wisconsin Corrections: Inmate Numbers Down, But Starting to Rise Again, 85 Wis. Taxpayer 1, 4 (Apr. 2017).
7 Wis. Leg. Fiscal Bureau, supra note 2, at 205.
8 Wis. DOC, Wisconsin Prison Admissions, 2000-2016 (2016) [https://perma.cc/AJX6-QPE9].
9 Wisconsin Prison Point-in-Time Populations, supra note 3.
10 Wisconsin Prison Admissions: 2000-2016, supra note 8.
11 Wisconsin, U.S. Census Bureau: Quick Facts (last visited Feb. 4, 2018) [https://perma.cc/WKE9-W2UT].
12 Nationally, from 2000 to 2015, the incarceration rate fell more than 24 percent for African-American men and almost 50 percent for African-American women. White women’s incarceration rate increased by 53 percent. Eli Hager, A Mass Incarceration Mystery, Wash. Post (Dec.15, 2017) [https://perma.cc/H3S7-KXLT].
13 In Wisconsin, the percentage of African-American women in prison fell from 46.9 percent to 20.91 percent, while the proportion of white and Native American women increased from 50 percent to 71 percent and from 3.6 percent to 7.0 percent, respectively. Wisconsin Prison Point in Time Populations, supra note 3.
14 Ashley Nellis, The Color of Justice: Racial and Ethnic Disparity in State Prisons, The Sentencing Project (June 14, 2016) [https://perma.cc/5LLB-T9RE].
15 Id.
16 State-by-State Data, The Sentencing Project (last visited Feb. 4, 2018) (reporting data for 2014).
17 Nellis, supra note 14 (citing U.S. Dep’t of Justice, Office of Justice Programs, Bureau of Justice Statistics, National Prisoner Statistics (1978-2014)).
18 Wisconsin had the highest rate of jail incarceration of Native Americans in the country in 2013. Danielle Kaeding, Survey: Wisconsin Led US in American Indian Incarceration Rate In 2013, Wis. Pub. Radio (Jan. 26, 2018).
19 Racial Disparities in Youth Commitments and Arrests, The Sentencing Project (Apr. 2016). Disparity in the Wisconsin rates of confinement of African-American youth compared to white youth is even starker than for adults, at 15.5 times the commitment rates for white youth. Id. African-American and Native American youth comprised 64.9 percent and 4.2 percent of Wisconsin’s incarcerated juvenile population as of September, 2017.Wis. DOC, Division of Juvenile Corrections, Corrections at a Glance, September 2017.
20 Among them was Judge Thomas H. Barland, chair of the Criminal Penalties Study Committee. Wis. Crim. Penalties Study Committee Final Rep. (Aug. 31, 1999). In the forward to the committee’s 1999 Final Report on the implementation of TIS, Judge Barland noted the “ever-increasing corrections population” and “the problem of racial disparity.” Id.
21 Criminal Justice Facts, The Sentencing Project (last visited Feb. 4, 2018).
22 Incarceration Trends: Prison Incarceration Rate, The Vera Inst. (last visited Feb. 4, 2018). The prison population grew from 7,000 in 1990 to more than 20,000 by the end of 1999. Id.
23 Id.; State-by-State Data, supra note 16.
24 Wis. Stat. § 973.014(1)(c) (2015-16) (applies to life sentences for offenses committed on or after Aug. 31, 1995, but before Dec. 31, 1999).
25 Presumptive mandatory release (PMR) permits the Parole Commission to deny release of a person convicted of a “serious felony” up to his maximum discharge date based on either 1) protection of the public or 2) the refusal of the prisoner to participate in certain treatment programs. Wis. Stat. § 302.11(1g)3. (2015-16).
26 The truth-in-sentencing legislation eliminated parole and required judges to impose a bifurcated sentence consisting of a period of confinement and a period of extended supervision. Wis. Stat. § 973.01 (2015-16).
27 Id.
28 Wis. Stat. §§ 301.11(7)(am), 302.113 (9)(am).
29 Wisconsin Prison Point-in-Time Populations, supra note 3; Wis. DOC, DAI – Admissions to Prisons Dashboard (last visited Feb. 4, 2018).
30 The number of persons sentenced to serve life sentences rose 68 percent, to more than 1,100 persons, and the average age of a person serving a life sentence increased 12 years, to 47 years old, between 2000 and 2016. Wisconsin Prison Point-in-Time Populations, supra note 3. Of the persons with life sentences, 223 have no possibility of release, compared to 37 in 2000. Information provided by the DOC, on file with the author.
31 Id.
32 Wis. DOC, Parole Eligible Inmates on December 31, 2014 (2014).
33 Id.
34 Criminal Penalties Study Committee Final Report app. D (Aug. 31, 1999). In 1997-98, 75 percent of men and 81 percent of women were granted discretionary parole. Wis. Leg. Fiscal Bureau, Adults Corrections Program: Informational Paper 54 (Jan. 2017).
35 Wis. DOC, Prison Releases: 2000-2016 (2017).
36 Wis. Stat. section 301.113(9g) applies to persons serving truth-in-sentencing sentences.
37 Prison admissions from Milwaukee County were 3,199 men and 330 women in 2000, 3,430 men and 263 women in 2007, and 2,317 men and 135 women in 2016. DAI – Admissions to Prisons Dashboard, supra note 29.
38 Jeffrey Toobin, The Milwaukee Experiment, The New Yorker (May 11, 2015).
39 Id.
40 Admissions from Milwaukee County comprised 58.1 percent of new youth commitments in the last quarter of 2017. Wis. DOC, Division of Juv. Corrections, Corrections at a Glance (2017).
41 Incarceration Trends: Prison Incarceration Rate, supra note 22; State-by-State Data, supra note 26.
42 Forward, supra note 1.
43 Id.
44 Marc Mauer & Nazgol Ghandnoosh, Fewer Prisoners, Less Crime: A Tale of Three States, The Sentencing Project (July 23, 2014). According to the same survey, Wisconsin had reduced its prison population by 4 percent from its peak, placing it slightly below the national average of de-incarceration. Some have suggested that the reduction in prison admissions from Milwaukee County after 2007 accounted for the 4 percent decrease in the prison population. Toobin, supra note 38.
45 Fewer Prisoners, Less Crime: A Tale of 3 States, supra note 44.
46 Id.
47 Criminal Justice Policy Program, Harvard Law School, Moving Beyond Money: A Primer on Bail Reform 6, 7 (2016).
48 A survey of states awarding “good time” or “earned time” listed Wisconsin as being in the small minority of states that had neither. Nat’l Council of St. Legislatures, Good Time and Earned Time Policies for State Inmates (Jan. 2015). Wisconsin’s previous system of good time and earned good time was repealed by 1983 Wis. Act 528.
49 Michigan enacted legislation in 2017 to limit incarceration for crimeless probation revocations to no more than 30 days. AP News Guide: Snyder Signs Criminal Justice Changes, U.S. News (Mar. 20, 2017).
50 Edith Brady-Lunny & Ted Gest, Justice Success Story: How Illinois Cut Its Prison Population, Crime Rep. (Jan. 29, 2018).
51 Id.
52 Wis. Stat. §973.09(3)(d) (2015–16).
53 Of those who are rearrested within five years after release from prison, more than three-quarters are rearrested in the first two years. Matthew R. Durose, Alexia D. Cooper & Howard N. Snyder, U.S. Dep’t of Justice, Recidivism of Prisoners Released in 30 States in 2005: Patterns from 2005 to 2010.
54 A 2016 three-year follow up recidivism report by the DOC showed recidivism rates of 14.5 percent, 25.1 percent and 31.3 percent in the first, second, and third years after release, in 2011, 2012, and 2013. Wis. DOC, Recidivism After Release From Prison (2016). In this report the DOC defines recidivism as committing a new offense within a specified follow-up period that results in a new sentence to either prison or probation (following a release from prison). Id.
55 Id.
